Medovia Medical
Learning how to interpret a multi-parameter patient monitor is a practical clinical skill, not a test of memorizing numbers. In a busy ward, a screen may show heart rate, oxygen saturation, blood pressure, respiratory rate, temperature, and waveforms within seconds. Each value offers a clue. None tells the complete story.
So, how should clinicians approach “How to read the data displayed on a multi-parameter patient monitor?” Critical-care physician Dr. Paul Marino has emphasized a valuable principle: “Numbers do not replace clinical judgment.” The statement is simple. It is also easy to forget when alarms sound repeatedly.
A reliable reader checks the patient before trusting the monitor. Look at skin color, breathing effort, alertness, pulse quality, and movement. Then compare the displayed values with recent observations. A sudden oxygen saturation of 82% may indicate deterioration, but it may also reflect a loose sensor, cold fingers, or motion. The waveform matters. The trend matters more than one isolated number.
This guide will explain how to connect numerical data with visible clinical signs. It will discuss alarm limits, signal quality, waveform patterns, and common interpretation errors. It will also show why normal-looking data can still hide danger.
Some explanations may remain imperfect. Patient monitors differ between manufacturers, and clinical settings change interpretation. That limitation deserves attention. A monitor supports assessment; it does not replace training, bedside examination, or local clinical protocols. Learning to question the screen may be as important as learning to read it.
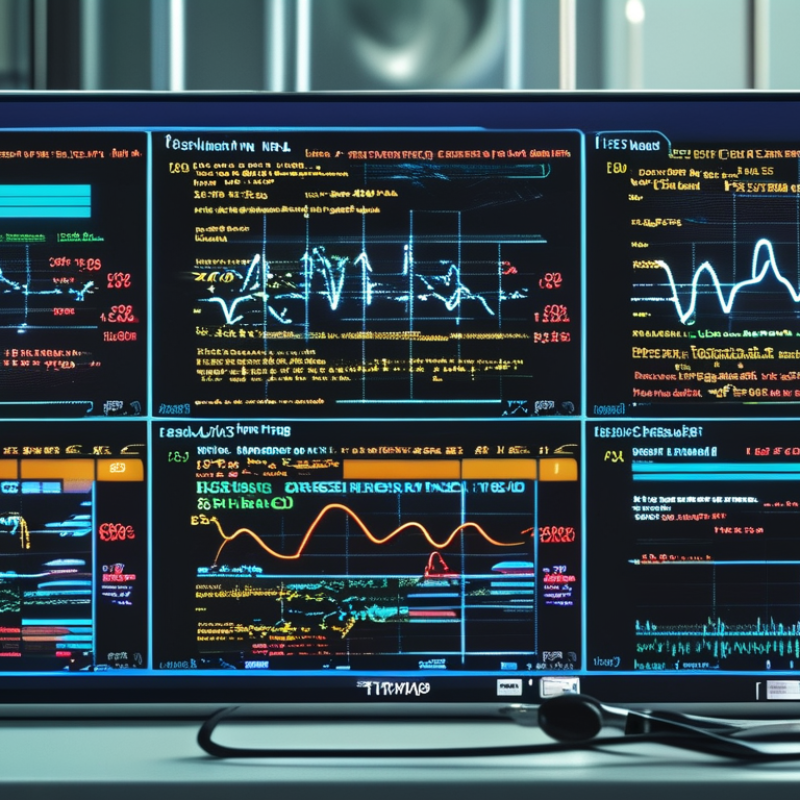
A multi-parameter patient monitor displays several vital signs in one view. Heart rate shows the speed of cardiac activity, often from an ECG waveform or pulse signal. Blood oxygen saturation estimates how much oxygen the blood carries. Non-invasive blood pressure provides systolic, diastolic, and mean arterial pressure readings. Temperature may reveal infection, inflammation, or changes in body regulation. Some monitors also measure respiratory rate and exhaled carbon dioxide, especially during anesthesia or critical care.
Numbers need context. A sudden oxygen decline may reflect poor probe contact, movement, cold fingers, or a real breathing problem. A fast heart rate can follow pain, fever, anxiety, or blood loss. Clinicians compare trends, waveforms, symptoms, and examination findings instead of trusting one isolated value. This is where careful training matters. The screen is useful, but it is not the patient.
Tips: Check the patient before checking the numbers. Confirm the sensor position and waveform quality. Record trends rather than reacting to every brief alarm. Use the monitor’s instructions and local clinical protocols. When a value conflicts with the patient’s appearance, reassess manually and escalate concerns appropriately.
Reading these measurements well takes practice. Even experienced staff can misread artifacts during movement. I still think every unexpected result deserves a second look.
Reading a multi-parameter patient monitor means connecting numbers with the patient in front of you. A heart rate of 110 may reflect pain, fever, anxiety, or poor signal quality. Check the patient before trusting the screen. Observe skin color, breathing effort, alertness, and pulse strength. Compare displayed blood pressure with a manual measurement when the result seems inconsistent. Oxygen saturation also needs context. Cold fingers, movement, nail products, and weak perfusion can distort readings. A single value is a clue, not a diagnosis.
Waveforms reveal timing and signal quality that numbers may hide. On an ECG waveform, examine rhythm regularity, QRS appearance, and possible pauses. Avoid labeling every irregular pattern without clinical assessment. The plethysmography waveform should rise and fall smoothly with each pulse. Small, uneven waves may suggest motion, poor circulation, or loose contact. A respiratory waveform can show changes in rate, pauses, or shallow effort. An arterial pressure waveform should have a clear upstroke and consistent shape. Distorted waves may result from tubing problems, air bubbles, or patient movement. Artifact can look convincing.
I have sometimes focused too quickly on an alarming number. That habit needs correction. Review the trend, alarm limits, patient position, sensor placement, and recent treatments. Ask whether the waveform supports the value. If the monitor shows severe deterioration but the patient appears stable, reassess the equipment and measure again. If the patient looks unwell, act on clinical findings while confirming the data. Careful interpretation requires technical knowledge, repeated practice, and the humility to question an apparently precise result.
This chart shows a 10-minute resting adult observation from a multi-parameter patient monitor. Heart rate, oxygen saturation, and respiratory rate are displayed on separate clinically appropriate scales.
How to interpret it: Heart rate is approximately 60–100 beats per minute, oxygen saturation is generally expected to remain at or above 95% in a healthy adult at sea level, and resting respiratory rate is commonly about 12–20 breaths per minute. Trends, waveform quality, patient condition, and clinical context should always be assessed together.
Accurate monitor reading supports clinical decisions by turning changing physiology into visible, actionable information. A monitor may display heart rate, rhythm, oxygen saturation, blood pressure, respiratory rate, and temperature. Each value answers a different clinical question. Together, they help clinicians recognize deterioration, assess treatment response, and decide when further evaluation is necessary.
A single number can mislead. A low oxygen reading may reflect poor probe contact, cold fingers, movement, or genuine respiratory compromise. A fast heart rate may follow pain, anxiety, fever, dehydration, or a dangerous rhythm. Clinicians should inspect the waveform, check signal quality, compare repeated measurements, and assess the patient directly. Skin color, breathing effort, alertness, and reported symptoms remain essential evidence. The screen is not the patient.
Trend recognition is especially valuable. A blood pressure that gradually falls after treatment may require a different response than one isolated low reading. Likewise, increasing respiratory rate can appear before oxygen saturation changes. Experienced staff link monitor data with medical history, medications, recent procedures, and laboratory findings. They also verify unexpected values manually when appropriate. I have seen how easily an alarming number captures attention, while a quiet trend receives less notice. That is a weakness worth challenging. Accurate interpretation requires technical knowledge, careful observation, and the humility to question both the device and one’s first impression.
Patient conditions can change monitor data within minutes. A fever may raise heart rate and breathing rate. Pain can produce a similar pattern. These readings need clinical context.
Low oxygen levels may appear during airway obstruction, lung disease, or shallow breathing. Cold fingers can also weaken the oxygen signal. Movement, sweat, and poor sensor contact may create unreliable values. The monitor may display a number, but the patient remains the priority.
Blood pressure can fall after fluid loss, medication effects, or internal illness. However, an incorrectly sized cuff may distort the result. A weak pulse can make readings less consistent. I have seen how one unusual value can attract too much attention. It is easy to trust the screen too quickly.
Respiration deserves careful observation. A normal rate does not always mean effective breathing. Watch chest movement, skin color, alertness, and speaking ability. Trends often matter more than one isolated measurement. Still, trends can mislead when sensors shift or settings change.
Electrocardiogram patterns may reflect stress, electrolyte imbalance, poor circulation, or abnormal rhythms. Interpretation requires training and confirmation through patient assessment. Documenting symptoms beside the numbers improves reliability. A quiet patient is not always a stable patient.
Why Learn How to Read Multi-Parameter Patient Monitor Data?
Common Errors in Reading Multi-Parameter Monitor Results
Multi-parameter monitor data can look precise, yet small interpretation errors are common. A bright number is not automatically reliable. Bedside training emphasizes checking the patient before trusting the screen. Skin color, breathing effort, pulse quality, and responsiveness may challenge a displayed value. The monitor supports clinical assessment. It does not replace it.
A common error is reading values separately. Oxygen saturation may appear acceptable while respiratory rate rises and consciousness worsens. Blood pressure can fall before the pulse oximeter changes. Another mistake is confusing a trend with a single reading. Movement, shivering, loose sensors, poor skin contact, and electrical interference can distort signals. Check waveform quality, sensor placement, units, and time stamps. Not every alarm signals immediate deterioration. Some alarms reflect narrow limits or brief artifacts. Still, silencing an alarm without checking its cause is unsafe.
Even careful readers can misinterpret a changing pattern under pressure. I have learned that a second look often matters more than a faster decision. When readings conflict with the patient, repeat the measurement and assess manually when appropriate. Compare current values with earlier observations, medication timing, and recent activity. Record the uncertainty clearly. A monitor may be wrong, and our first interpretation may be wrong too.
| Monitor Parameter | Typical Adult Reference Range* | Example Display | Common Reading Error | More Accurate Interpretation | Important Verification Step |
|---|---|---|---|---|---|
| Heart Rate (HR) | 60–100 beats/min at rest | HR 118 beats/min | Assuming the displayed rate is always accurate without checking the waveform or rhythm. | A high rate may reflect pain, fever, anxiety, dehydration, hypoxia, arrhythmia, or another clinical problem. Irregular rhythms can make automated counting less reliable. | Compare the ECG tracing with the pulse waveform and manually assess the pulse when the result is unexpected. |
| Electrocardiogram (ECG) | Sinus rhythm commonly shows a regular rhythm with a P wave before each QRS complex; normal intervals depend on the patient and clinical context. | Irregular narrow-complex rhythm | Treating ECG artifact, muscle tremor, or loose electrodes as a true arrhythmia. | The monitor ECG is useful for rhythm observation, but a diagnostic 12-lead ECG may be required to evaluate ischemia, conduction abnormalities, or rhythm origin. | Inspect electrode contact, reduce motion, confirm lead placement, and obtain a 12-lead ECG when clinically indicated. |
| Oxygen Saturation (SpO₂) | Usually 95–100% at sea level in healthy adults; individualized targets may apply in chronic lung disease or other conditions. | SpO₂ 88%, weak waveform | Reading a low value as definite hypoxemia without checking signal quality, perfusion, or the patient. | Cold extremities, motion, poor perfusion, nail products, ambient light, dyshemoglobins, and incorrect sensor placement can affect accuracy. Altitude and disease-specific targets also matter. | Assess breathing and color, verify the plethysmographic waveform, warm or reposition the sensor, and repeat the measurement. |
| Respiratory Rate (RR) | 12–20 breaths/min at rest | RR 8 breaths/min | Assuming a normal displayed rate excludes hypoventilation or counting artifact. | Impedance-derived RR may be distorted by movement, talking, shallow breathing, or poor electrode contact. Rate alone does not show tidal volume or ventilation adequacy. | Count respirations directly and assess work of breathing, mental status, oxygenation, and, when available, end-tidal carbon dioxide. |
| Non-Invasive Blood Pressure (NIBP) | For many nonpregnant adults, a resting office BP below 120/80 mmHg is considered normal; interpretation depends on repeated measurements and clinical context. | BP 86/54 mmHg; MAP 65 mmHg | Ignoring cuff size, arm position, movement, or repeated-measurement requirements. | A small cuff can overestimate pressure and a large cuff can underestimate it. A single reading should be interpreted with symptoms, trends, and perfusion findings. | Use the correct cuff, position the arm at heart level, keep the patient still, repeat unexpected results, and compare with manual measurement if needed. |
| Mean Arterial Pressure (MAP) | Often approximately 70–100 mmHg in healthy adults; treatment thresholds are patient-specific. | MAP 58 mmHg | Using MAP as a standalone diagnosis or assuming the same target applies to every patient. | MAP is an estimate of average arterial pressure and should be considered alongside mental status, urine output, skin perfusion, lactate, disease state, and clinical trends. | Confirm the blood-pressure measurement and assess the patient for signs of inadequate or excessive perfusion. |
| Body Temperature | Approximately 36.5–37.5 °C orally in many healthy adults; normal values vary by site and time of day. | Temperature 35.2 °C | Comparing oral, axillary, tympanic, and skin readings as if they were interchangeable. | Measurement site, device technique, ambient temperature, sweating, and recent activity can change the result. A low peripheral skin temperature may not equal core hypothermia. | Record the measurement site, repeat abnormal values, and confirm with an appropriate method when the result conflicts with the clinical picture. |
| End-Tidal CO₂ (EtCO₂) | Approximately 35–45 mmHg in many spontaneously breathing adults at sea level. | EtCO₂ 25 mmHg with a small waveform | Interpreting the number without examining the capnogram shape, sampling line, or ventilation context. | A low value can occur with hyperventilation, reduced pulmonary blood flow, leak, or poor sampling. A high value may indicate hypoventilation, increased CO₂ production, or rebreathing. | Check the waveform, airway or nasal sampling position, tubing for obstruction or leaks, respiratory rate, and clinical condition. |
| Pulse Rate vs. ECG Rate | The pulse rate and ECG heart rate are often similar during a regular rhythm. | ECG HR 110; pulse rate 76 beats/min | Assuming every electrical beat produces a palpable peripheral pulse. | A pulse deficit may occur with premature beats, atrial fibrillation, low stroke volume, or poor peripheral perfusion. | Compare ECG, pulse waveform, and palpated pulse; investigate a persistent discrepancy promptly. |
| Alarm Interpretation | Alarm limits should be individualized to the patient and care setting. | Repeated high-rate alarm | Silencing or disabling alarms without identifying the cause. | Alarms may represent a true physiological change, artifact, incorrect limits, or technical failure. Alarm priority does not replace clinical assessment. | Assess the patient first, verify the displayed parameter and waveform, correct technical problems, and document clinically appropriate alarm limits. |
*Reference ranges are general educational values for resting adults at or near sea level. Age, pregnancy, altitude, medications, chronic disease, activity, measurement site, and clinical condition can change interpretation. Monitor readings should be confirmed and interpreted by qualified healthcare professionals.
It can display heart rate, oxygen saturation, blood pressure, and temperature. Some models also show respiratory rate and exhaled carbon dioxide.
The monitor supports assessment but cannot replace it. Observe breathing effort, skin color, pulse quality, alertness, and responsiveness.
Poor probe contact, movement, cold fingers, sweat, or weak circulation may distort the signal. A genuine breathing problem is also possible.
Fever and pain may raise heart rate and respiratory rate. Anxiety can create a similar pattern. Numbers need symptoms and examination findings.
An incorrectly sized cuff can distort results. Fluid loss, medication effects, weak pulses, and movement may also affect consistency.
Not always. Check the waveform, sensor position, units, and time stamp first. Repeat the reading when appropriate.
No. Watch chest movement, skin color, alertness, and speaking ability. A quiet patient is not always stable.
Reading each value separately can hide a worsening pattern. Oxygen may look acceptable while breathing rises and consciousness declines.
Reassess manually and repeat the measurement when appropriate. Compare earlier trends, symptoms, activity, and medication timing.
No. Some alarms reflect brief movement or narrow settings. Never silence an alarm without checking its cause. A second look matters.
Learning how to read multi-parameter patient monitor data is an important skill for understanding a patient’s current condition and recognizing possible changes early. These monitors commonly display measurements such as heart rate, blood pressure, oxygen saturation, respiratory rate, temperature, and related waveforms. How to read the data displayed on a multi-parameter patient monitor? Begin by identifying each parameter, checking its unit and trend, and comparing the numerical values with the corresponding waveform. A single abnormal reading should be considered alongside the patient’s symptoms and overall clinical context.
Accurate interpretation can support timely clinical decisions, but monitor data may be affected by movement, poor sensor contact, electrical interference, irregular breathing, or changes in the patient’s condition. For this reason, users should confirm unexpected results, assess waveform quality, and avoid relying on one number alone. Understanding common reading errors and recognizing how different conditions influence vital signs helps promote safer, more informed patient observation.